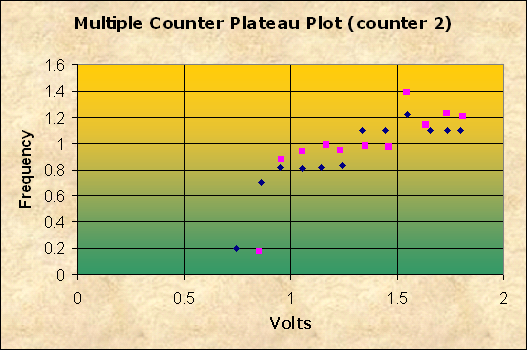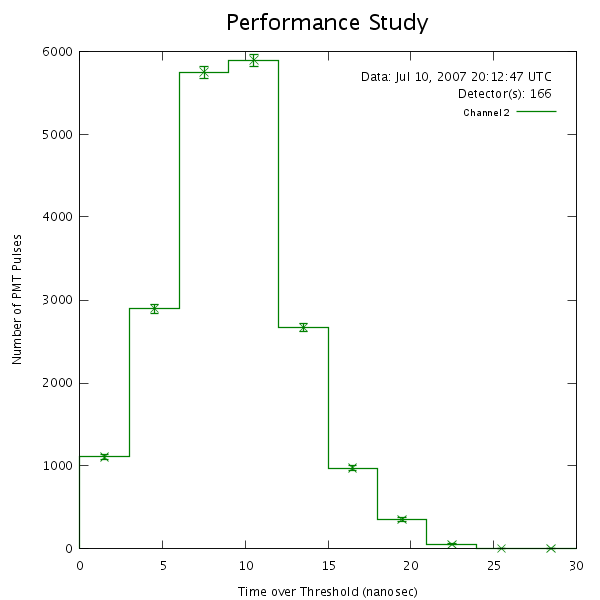
The plateau is in about the middle of the graph. To more precisely find the optimum voltage a performance study was used. You can see this study at the bottom of the page.
Here are the values for the above graph. Two seperate tests were made. The first test used counters two, three, and four, and the second used counters one, two, and four to plateau counter two.
| Blue | Pink | |||||
|---|---|---|---|---|---|---|
| Volts | 2&3&4 3&4 | Counts per Minute (2&3&4) | Volts | 1&2&4 1&4 | Counts per Minute (1&2&4) | |
| 0.724 | 0.2 | 16 | 000 | 000 | ||
| 0.863 | 0.7 | 472 | 0.853 | 0.18 | 91 | |
| 0.952 | 0.8 | 578 | 0.956 | 0.88 | 444 | |
| 1.053 | 0.8 | 576 | 1.056 | 0.94 | 476 | |
| 1.145 | 0.8 | 597 | 1.166 | 0.99 | 500 | |
| 1.241 | 0.8 | 594 | 1.234 | 0.95 | 482 | |
| 1.335 | 1.1 | 787 | 1.351 | 0.98 | 494 | |
| 1.446 | 1.1 | 788 | 1.462 | 0.97 | 489 | |
| 1.548 | 1.2 | 843 | 1.545 | 1.39 | 703 | |
| 1.651 | 1.1 | 777 | 1.636 | 1.14 | 576 | |
| 1.731 | 1.1 | 751 | 1.734 | 1.23 | 622 | |
| 1.798 | 1.1 | 746 | 1.805 | 1.21 | 614 | |
Counters one and two were set to a voltage of 1.106 volts and kept constant. Their coincidence was measured three times, when counter two was at 0.742, 1.053, and 1.241 volts. The counts per minute were 685, 648, and 779, respectivly. The average was 704 counts per minute.
Counters one and four were set to a voltage of 1.104 volts and kept constant. Their coincidence was measured three times, when counter two was at 1.056, 1.351, and 1.636 volts. The counts per minute were 521, 489, and 507 respectivly. The average is 507 counts per minute.

This study was run at 1.173 volts. It has the desired distribution showing that voltage to be the optimum.