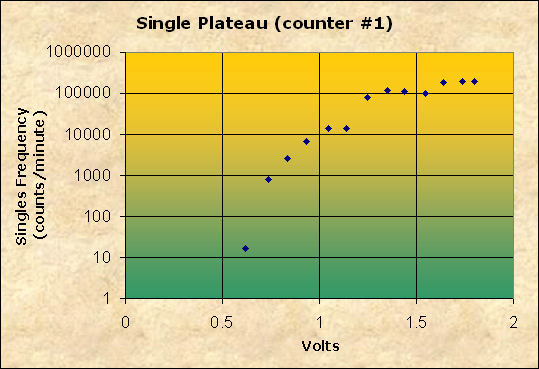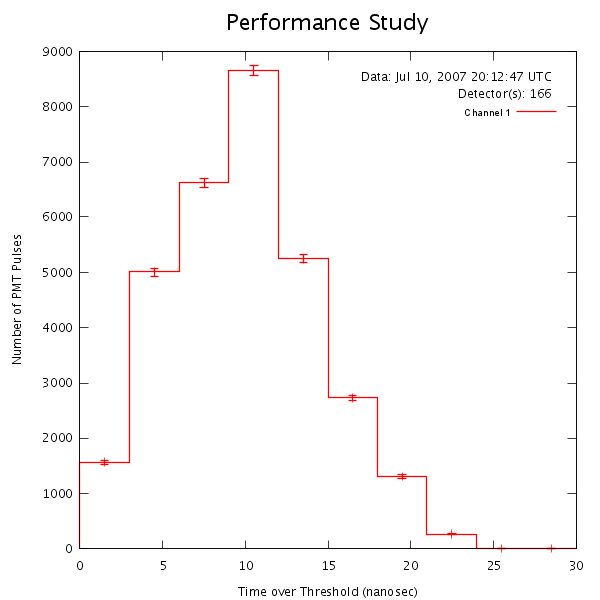
The plateau on this graph is hard to see. It levels out, then kind of stair-steps up. The optimum voltage was found using multiple counter plateauing and performance studies. The performance study can be seen below.
Here are the values for the above graph.
| Volts | Singles Frequency |
|---|---|
| 0.622 | 17 |
| 0.739 | 769 |
| 0.835 | 2588 |
| 0.934 | 6667 |
| 1.041 | 14382 |
| 1.134 | 14202 |
| 1.242 | 80791 |
| 1.349 | 117892 |
| 1.435 | 112335 |
| 1.543 | 98517 |
| 1.634 | 179609 |
| 1.733 | 189675 |
| 1.798 | 189527 |

With not too many short pulses, giving the desired Gaussian distribution it looks like this is the optimum voltage. This study was run at 0.996 volts.
Note: This is the same study as shown for counter one in the multiple counter plateauing.