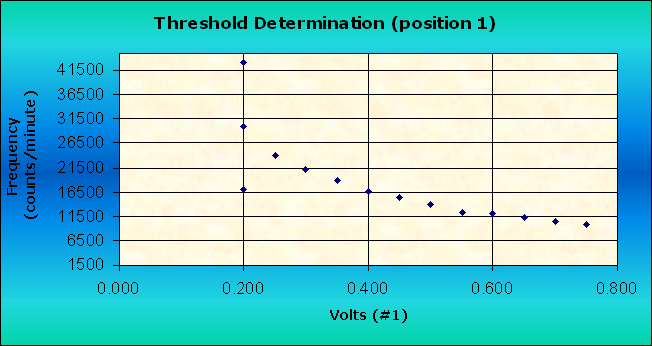
The PMT voltage was set to 1.104 volts and kept constant throughout the experiment. The the optimum frequency appears to be around 0.500 volts on this graph.
Below are the values for the graph.
| Volts | Frequency |
|---|---|
| 0.200 | 17118 |
| 0.200 | 42997 |
| 0.200 | 30039 |
| 0.250 | 24073 |
| 0.300 | 21155 |
| 0.350 | 18787 |
| 0.400 | 16664 |
| 0.450 | 15251 |
| 0.500 | 14079 |
| 0.550 | 12405 |
| 0.600 | 12010 |
| 0.650 | 11174 |
| 0.700 | 10455 |
| 0.750 | 9883 |
Note: The counts per minute at 0.200 volts was measured twice, the third value is the average of the first two.