| Volts | Frequency |
|---|---|
| 0.250 | 14742 |
| 0.300 | 9550 |
| 0.350 | 6552 |
| 0.400 | 4924 |
| 0.450 | 4100 |
| 0.500 | 3546 |
| 0.550 | 3255 |
| 0.600 | 2904 |
| 0.650 | 2647 |
| 0.700 | 1477 |
| 0.750 | 2214 |
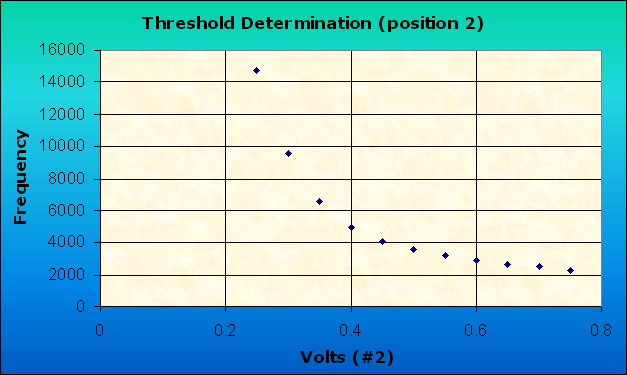
The PMT voltage was set to 1.110 volts, and remaind constant for the experiment. The graph becomes linear at about 0.500 volts, so the optimum frquency is about there.