| Volts | Frequency |
|---|---|
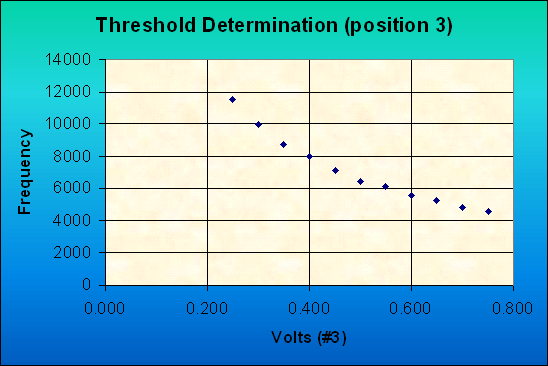
| 0.250 | 11486 |
| 0.300 | 10030 |
| 0.350 | 8751 |
| 0.400 | 7991 |
| 0.450 | 7163 |
| 0.500 | 6417 |
| 0.550 | 6132 |
| 0.600 | 5588 |
| 0.650 | 5214 |
| 0.700 | 4867 |
| 0.750 | 4561 |
The PMT voltage was set to 1.104 volts and kept constant throughout the experiment. This graph does not straighten out the same way the others do, though it does appear to become a bit more linear aroung 0.500 volts.