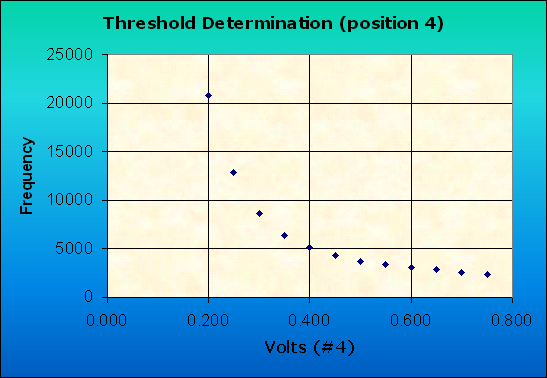
| Volts | Frequency |
|---|---|
| 0.250 | 6729 |
| 0.300 | 5801 |
| 0.400 | 4524 |
| 0.450 | 4080 |
| 0.500 | 3778 |
| 0.550 | 3346 |
| 0.600 | 3096 |
| 0.650 | 2817 |
| 0.700 | 4857 |
| 0.750 | 2465 |
The PMT voltage was a constant 1.104 volts throughout the experiment. It is hard to tell, but the graph appears to become linear around 0.500 volts.