September 9, 1999
55mi/hr = 24.6m/s
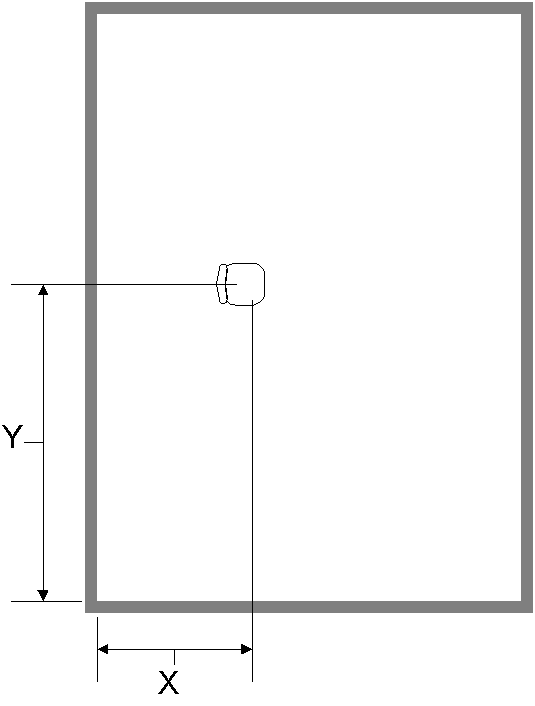
It is often useful to use coordinate systems to define where
things are. For instance, to specify the location of a chair in a
room (a rectangular room), we can give the (perpendicular)
distances of the chair from two adjacent walls
as shown to the right. Here I have labeled one of the distances X and the other Y, and we write the location of the chair as (X,Y). If the chair is 2m from the left wall and 5m from the bottom wall, then it's location is (2m, 5m). This type of coordinate system is known as a rectangular or Cartesian coordinate system. Notice that this type of coordinate system needs:
In this example, distances are measured in meters.
Show example with "standard" x-y coordinate system, and mark some positions on the plane.
Another way to specify a location is to give its distance from the origin, and its angle from a reference line, usually taken to be the x-axis. This is commonly called an r-theta, or polar coordinate. Show some examples of locating points with polar coordinates.
 We will have many occasions to make use of the
properties of right triangles.
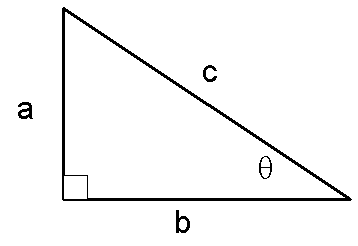
Recall that for a right triangle, such as the one pictured here, Pythagoran's theorem states that
a2 + b2 = c2
And, from trigonometry, we have the relations:
sinq = a / c
cosq = b / c
tanq = a / b
We will have many occasions to use these relations to:
Students should read through this now. I will return to this topic when I work examples.
Mechanics is divided into two areas: dynamics, a cause and effect analysis of motion; and kinematics, the description of motion. We begin with kinematics of motion in one dimension.
To descripe motion, we need to keep track of how the position of an object changes. A change in position is called a displacement, and is defined as the difference between the final and initial positions:
Dx = xf - xi
This calculation requires that first you establish a coordinate axes for measuring the position x.
Sketch a displacement, and show an example of how to calculate a positive and negative displacement.
Displacement is a vector. A vector is a quantity that has both a magnitude (value) and a direction. In the one dimensional case, the direction is rather easy, it is either positive or negative (right or left). In 2 dimensions, you must be more precise to indicate the direction.
We define the average velocity of an object to be its displacement divided by the time interval for that displacement:
vavg = Dx / Dt = (xf - xi) / (tf - ti)
A swimmer crosses a 50m pool in 20s, and returns to her starting point in an additional 22s. (a) What is her average velocity for the first half of the swim?
(b) What is her average velocity for the second half of the swim?
Follow the same steps as above, but now the displacement is in the opposite direction, so let's call it -50m, and the time interval is 22s. Now vavg = 2.3m/s.
(c) What is her average velocity for the round trip?
Again, follow the same steps as above. Since she returns to her starting point, xf = xi and the displacement is zero. The time interval is 20s+22s = 42s. Note a curious thing about our definition about the average velocity, even though there is motion during a time interval, if the ending point is the same as the starting point, then the displacement is zero, and the average velocity is zero. This is the case here. Her speed is never zero, it is on average 100m/42s = 2.4m/s. But due to the formal, Physics definition, her average velocity is zero!
It may be helpful to visualize the above problem on a graph of position versus time.
On such a graph, the average velocity between two points is simply the slope of the line connecting the two points. The points represent the position of an object at a particular time. Note that even though the object moves in a straight line (along x), the line on the graph doesn't have to be straight. This is because the line doesn't represent the direction of motion, but shows the position as a function of time.
In the above graph, the velocity changes from instant to instant. We can see this by choosing different final points, and noting that the average velocity (the slope of the straight line connecting the initial and final points) is not constant. What would the graph look like if the object were moving at a constant velocity? (ans. a straight line)
The instantaneous velocity, v, is defined as the limit of the average velocity as the time interval Dt becomes infinitesimally short:
v = limit as Dt goes to 0 [Dx/Dt]
Graphically, the instantaneous velocity at a point is given by the slope of the line tangent to the position versus time curve at that point.
The instantaneous speed is the magnitude of the instantaneous velocity.
Acceleration is probably a familiar concept to everyone. Most people are familiar with the feeling of acceleration in a car or bus. In Physics, acceleration has a formal definition that may sometimes differ from common usage. The average acceleration is defined as the change in velocity during an interval of time:
aavg = Dv/Dt = (vf - vi) / (tf - ti)
Note that acceleration can be positive (increasing velocity) or negative (decreasing velocity, also called deceleration). And when we work problems in more than one dimension, we can have acceleration even though the speed is constant -- the direction of the velocity changes, but the magnitude remains the same.
A car is travelling initially at +7.0m/s. It accelerates at a rate of +0.80m/s2 for 2.0s. What is the final velocity?
© Robert Harr, 9 September 1999