Recall from last lecture:
| Quantity | Forbidden Reaction | Comment |
|---|
| Charge | pp –> p‾p | Charge conservation rules out reactions such as the above. |
Energy / Momentum | g –> e+e- | This is called pair creation and can only happen in the presence of other matter; energy and momentum cannot both be conserved in this reaction. |
| Angular Momentum | r0 –> gg | |
| Lepton Number | m- –> e-g | Lepton number conservation forbids this decay; neutrino oscillation indicates that lepton number can be violated in weak interactions. |
| Baryon Number | p –> p0e+ | Baryon number conservation means that the lightest baryon, the proton, is absolutely stable; some GUT's predict proton decay, but with a lifetime of >1031 years. |
| Quark Flavor | L –> pp- | Strangeness is conserved in strong and EM interactions; this is weak decay, explaining the long lifetime of the lambda. |
To help with the third homework problem I should include a row in the table of baryons for the neutron.
The neutron is a baryon composed of udd quarks, has mass 939.56533 MeV, and has zero strangeness.
The Cosmic Connection
I encourage you to read this section.
Particle physics is important in the theory of the big bang, the processes in stars, and the collapse of stars into white dwarfs, neutron stars, and black holes.
I will discuss these topics later as time permits.
Chapter 2: Interactions and Fields
Classical and Quantum Pictures of Interactions
The classical picture of interactions is of one particle that creates a field (gravitational or electromagnetic field), and that field acts on another particle.
This picture is used even in non-relativistic quantum mechanics, for instance in our picture of the hydrogen atom.
The potential used in the Schrodinger equation is the electrostatic potential of the proton.
Example: Photon Exchange
 In particle physics we have a different picture.
Particles interact with each other by exchange of another object.
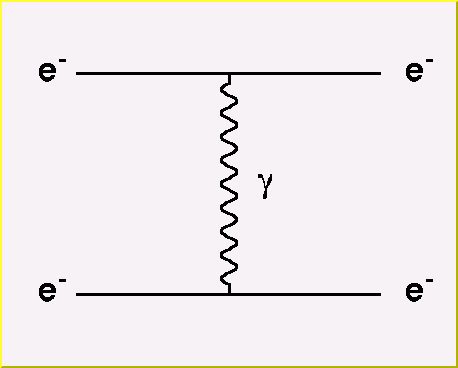
As an example, let's consider the exchange of a photon between two electrons.
We represent this with a Feynman diagram as shown to the right.
In this diagram, we imagine time progressing from left to right.
(Time increasing to the right is the modern convention used in the literature.
In some older texts and literature you will find diagrams where time increases up the page.
This is just a convention and doesn't change the results.)
Initially the system consists of two electrons, each represented by a solid line beginning on the left side of the diagram.
The final state also consists of two electrons, represented by the two solid lines ending on the right side of the diagram.
Somewhere inbetween, a photon is exchanged between the two electrons, represented by the wavy line running vertically between the two electron lines.
Feynman diagrams are useful because they connect our picture of an interaction in physical space with the equations that give us the matrix element for the process.
We will discuss and develop these ideas in the coming lectures.
For now, I will give some general rules for drawing Feynman diagrams.
Rules for Drawing Feynman Diagrams (version one)
- The horizontal direction is the horizontal direction, increasing from left to right.
The vertical direction represents all other spatial directions.
The left side of the diagram represents the initial state, and the right side represents the final state.
(Again, some authors draw time in the vertical direction, in which case you can rotate the drawing clockwise by 90° to get our convention.)
- Fermions are drawn as continuous, solid lines.
A fermion line can end only in the initial or final states (left or right side of the diagram).
- Bosons are drawn as dashed lines, wavy lines, or loopy (helix or spring-like) lines.
Photons are represented by wavy lines, gluons by loopy lines, and Z° or W± by either wavy lines or dashed lines.
- Lines should be labeled to avoid confusion.
This is enough to start with, let's use these to look at a more complex interaction.
Bhabha Scattering
Bhabha scattering is named for the Indian physicist who first calculated the process.

Copyright © Robert Harr 2003
 In particle physics we have a different picture.
Particles interact with each other by exchange of another object.
As an example, let's consider the exchange of a photon between two electrons.
We represent this with a Feynman diagram as shown to the right.
In this diagram, we imagine time progressing from left to right.
(Time increasing to the right is the modern convention used in the literature.
In some older texts and literature you will find diagrams where time increases up the page.
This is just a convention and doesn't change the results.)
